Learning Objectives
Following this assignment students should be able to:
- Use local and global macros to store values and variable lists
- Store and reuse results from commands using macros and scalars
- Write custom subroutines using
capture program dropandprogram define- Automate repetitive tasks using forvalues and foreach loops
- Apply conditional logic (if, continue) inside loops to control code flow
- Generate multiple summaries, regressions, and graphs with minimal repeated code
Reading
Topics
- Macros
- Storing data
- Loops
- Writing commands
Readings
- Reading: Programming
Lecture Notes
Exercises
-
Using Locals in Regressions (10 pts)
In this exercise you will use local macros to store variable lists and reuse them in multiple regressions. For this week’s assignment we will use
eth_allrounds_final.dtaso start by loading that data set.Create a local macro named
controlsthat contains three plot- or household-level control variables:crop_shock(1 = experienced shock, 0 = no shock)irrigated(1 = irrigated, 0 = not irrigated)hh_asset_index(household asset index)
-
Use this macro to regress of
yield_kgonnitrogen_kgand the controls stored incontrolsbut onlyifthe variablecrop_nameequals maize. What are the coefficients on each control that is statistically significant at the 90% level? -
Now modify the macro definition so that the controls also include
female_manager(1 = if the plot manager is female, 0 = if male). Re-run the regression without changing the regression lines themselves. What are the coefficients on each control that is statistically significant at the 90% level?
-
Using Locals to Store Results (10 pts)
Using
eth_allrounds_final.dta,-
Summarize
yield_kgand store the mean and standard deviation from this command in locals namedmean_yieldandsd_yieldusingr(mean)andr(sd). Use these locals to create a standardized yield variable calledyield_std. Recall from your stats classes, to standardize a variable you subtract the mean value from the variable and then divide the difference by the standard deviation. What is the mean and standard deviation ofyield_std? -
Use the
displaycommand and your locals to print the following sentence “Mean yield on Ethiopian plots is`mean_yield'kg with standard deviation of`sd_yield'kg.”
-
-
Using Globals (10 pts)
In this exercise you will practice using a global macro to store a cutoff that is reused in several commands. Remember: in this course, locals are preferred almost always; this exercise is to help you understand how globals work and why they can be risky.
Define a global macro named
lg_cutthat stores the size (in hectares) above which you will consider a plot “large”. Use 1 hectare as the cutoff.1. Create a new indicator variable
large_plotthat equals 1 ifplot_area_GPSis strictly greater than$lg_cutand 0 otherwise. Label the variable as “= 1 if plot area > 1 ha”. How many large plots are there in the data set?2. Use
sumandifto compute the meanyield_kgon large and non-large plots. What is mean yield in each group?3. Download the following code files and place this in the folder where you keep all your code. That should be the path that
$codepoints to.Add the line
do "$code/00_main.do"to your code under**## 3.3. Run00_main.do. What cutoff does the output claim was used (in the printed header and in the variable label)? What cutoff was actually used to generate large_plot?4. Diagnose the inconsistency by adding these lines to the end of
03_tables.doand re-running00_master.dogen large_plot_using_current_global = plot_area_GPS > $plot_cutoff_ha tab large_plot large_plot_using_current_globalDo
large_plotandlarge_plot_using_current_globalmatch? Why or why not?5. Fix the problem by changing the name of the
globalin02_revise. Re-run00_main. What cutoff does the output claim was used?
-
Storing Results as Numbers (10 pts)
Here you will practice storing regression output in scalars and using them later.
-
Run a regression of yield (
yield_kg) on fertilizer (nitrogen_kg) and plot characteristics (plot_area_GPS irrigated). Using thee()objects, store the R-squared and the number of observations from this regression in scalars namedrsq_yieldandN_yield. Usingdisplay, what are the R-squared value and number of observations? -
Immediately after, run the same regression but with
harvest_value_USDas the dependent variable instead ofyield_kgThis will overwritee(r2)ande(N). Store the R-squared from the second regression in alocalmacro namedrsq_harv. Usingdisplay, what is the R-squared value?
-
-
For Values (10 pts)
In this exercise you will use
forvaluesto loop over survey waves and compute summary statistics.-
Use
tabto determine how many survey waves (wave) are in the data set. How many waves are in the data set? - Use a
forvaluesloop to summarizeyield_kgseparately for each wave. Your code should:- Loop over all integer values of
waveobserved in the data (for example,1/3if there are 3 waves). - For each wave:
- Display a header line like
"Wave 1". - Run
summarize yield_kg if wave == ....
- Display a header line like
Example structure (modify the range to match your data):
forvalues w = 1/3 {
    display "------------------------"
    display "Summary for wave `w'"
    summarize yield_kg if wave == `w'
}
What is mean yield in each wave?
- Loop over all integer values of
- Extend your loop so that for each wave it also summarizes
nitrogen_kg. What is mean nitrogren use in each wave?
-
-
For Each (10 pts)
This exercise uses
foreachto loop over lists of variables.- Use
foreachto run a one-way tabulation (tab) for the following shock indicator variables:crop_shockpests_shockrain_shockdrought_shockflood_shock
How many plots experienced each type of shock?
- Modify the loop so that it also calculates the share of plots that experienced the shock (i.e., where the shock variable == 1). For each shock, use
sum,if, andr(mean)to store that share in a local macro named`share_`shock'`and display the result as:
* Print as percent with one decimal place
  display   "About " %4.1f (100*`share_`shock'') "% of plots experienced a `shock'."
What share of plots experienced each type of shock?
- Use
-
Combining Macros and Loops (10 pts)
Here you’ll combine
localmacros andforeachloops along withvarlistto create new variables and run multiple regressions.- Create a local macro named
logvarsthat contains three nonnegative variables that you expect to be skewed:yield_kgharvest_value_USDtotcons_USD
Use a
foreachloop over the variables inlogvarsto create log-transformed versions of each variable:- For each variable
vinlogvars, generateln_v’ = ln(v') - Label each new variable
"log of v" - Use
sumto calculate the mean for each logged variable
What is the mean value of each variable?
- Now define two more local macros:
local yvars ln_*local controls plot_area_GPS irrigated nitrogen_kg female_manager
Use a
foreachloop to run regressions of each outcome inyvarson the same set of controls. In each regression, what controls are not significant?
- Create a local macro named
-
Conditional Loops (20 pts)
In this final exercise you’ll use programming
if,foreach, andcontinueto control what happens inside a loop based on sample size.Goal: For a list of variables, automatically summarize and graph them, but skip variables that have too few non-missing observations. Start bv defining a local macro named
varswith the following variables:yield_kgharvest_value_USDnitrogen_kgtotcons_USD
- Write a
foreachandvarlistto loop overvars. Inside the loop, for each variablev:- Run
`qui sum `v', detail - Store the number of non-missing observations in a local
Nusingr(N)(remember to use=so that the local equals the expression and not the literal textr(N)). Then, still within the loop, have Statadisplaythe number of observations for each variable. How many observations are there for each variable?
- Run
-
Check That Your Code Runs (10 pts)
Sometimes you think you’re code runs, but it only actually works because of something else you did previously. To make sure it actually runs you should save your work and then run it in a clean environment.
Follow these steps in to make sure your code really runs:
-
Restart Stata by closing the instance of Stata that you have open.
-
When you reopen Stata, type in the command line
clear all. Or, better yet, putclear allat the top of your.dofile, after the preamble but before any commands. -
Rerun your entire homework assignment by clicking the
Executebutton to make sure it runs from start to finish and produces the expected results. -
Make sure that you saved your code with the name of the assignment number (i.e.,
assignment_01). You should see the file in your git repo on your machine. -
Make sure that your code will run on other computers (relevant for all assignments after the first assignment)
- No
cd. Use aproject.dofile instead to set directories - Use only relative paths in files other than the
project.dofile - Use
/not\for paths
- No
-
-
Challenge 6 (10 pts)
This challenge builds immediately on the loop you wrote in exercise 8. The goal is to put everything together in something closer to real work. For a list of variables, we will write loops to produce:
- A table of summary statistics
- A histogram saved to disk for each variable
The loop you wrote for exercise 8 should look something like:
* create a local of continuous variables
    local				vars yield_kg harvest_value_USD nitrogen_kg totcons_USD

* loop over each variable and print out the number of observations
	foreach v of varlist `vars' {
		qui sum 			`v', detail
		local				N = r(N)
		display				`N'
	}
Within this loop, add a programming
ifstatement that for variables stricly less than (<) 63,450displays as textthe following: “Skipping`v'(only`N'non-missing obs)”. Recall that after a programmingif ...statement you need{}and it is inside these brackets where you put the text you want displayes if the statement is true.Within this
ifloop, uscontinueto to tell Stata to move on to the next variable (this will have the effect of Stata moving onto the next variable without graphing variables with observations< 63450).Outside of the
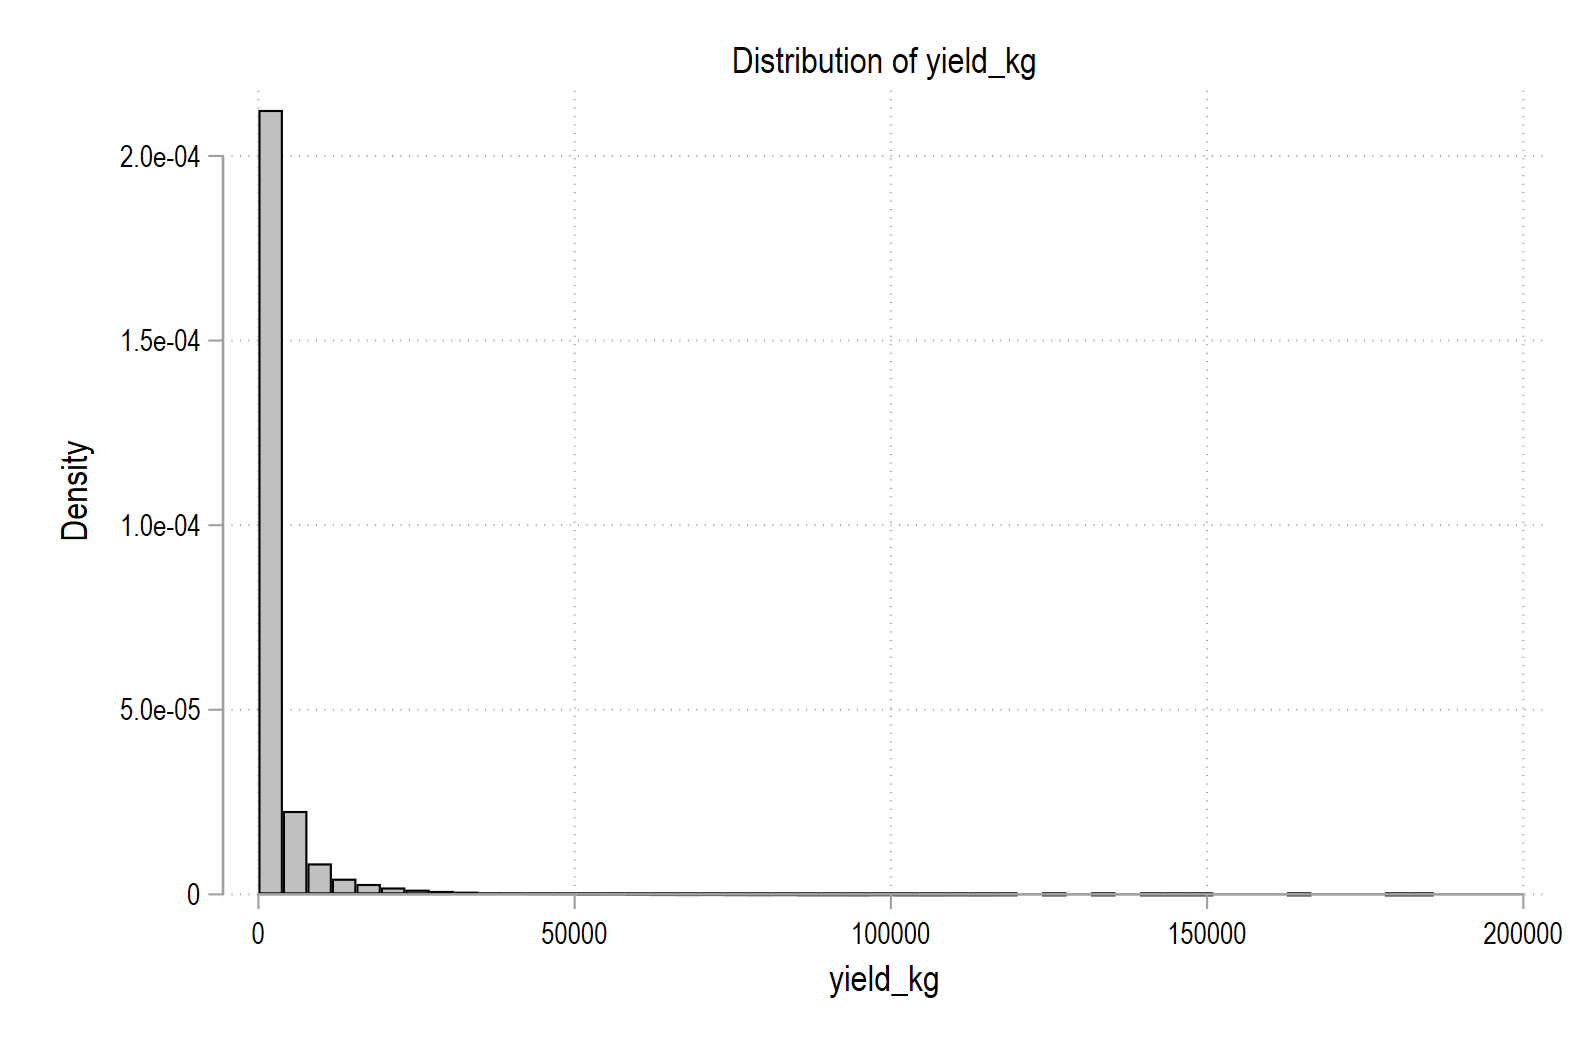
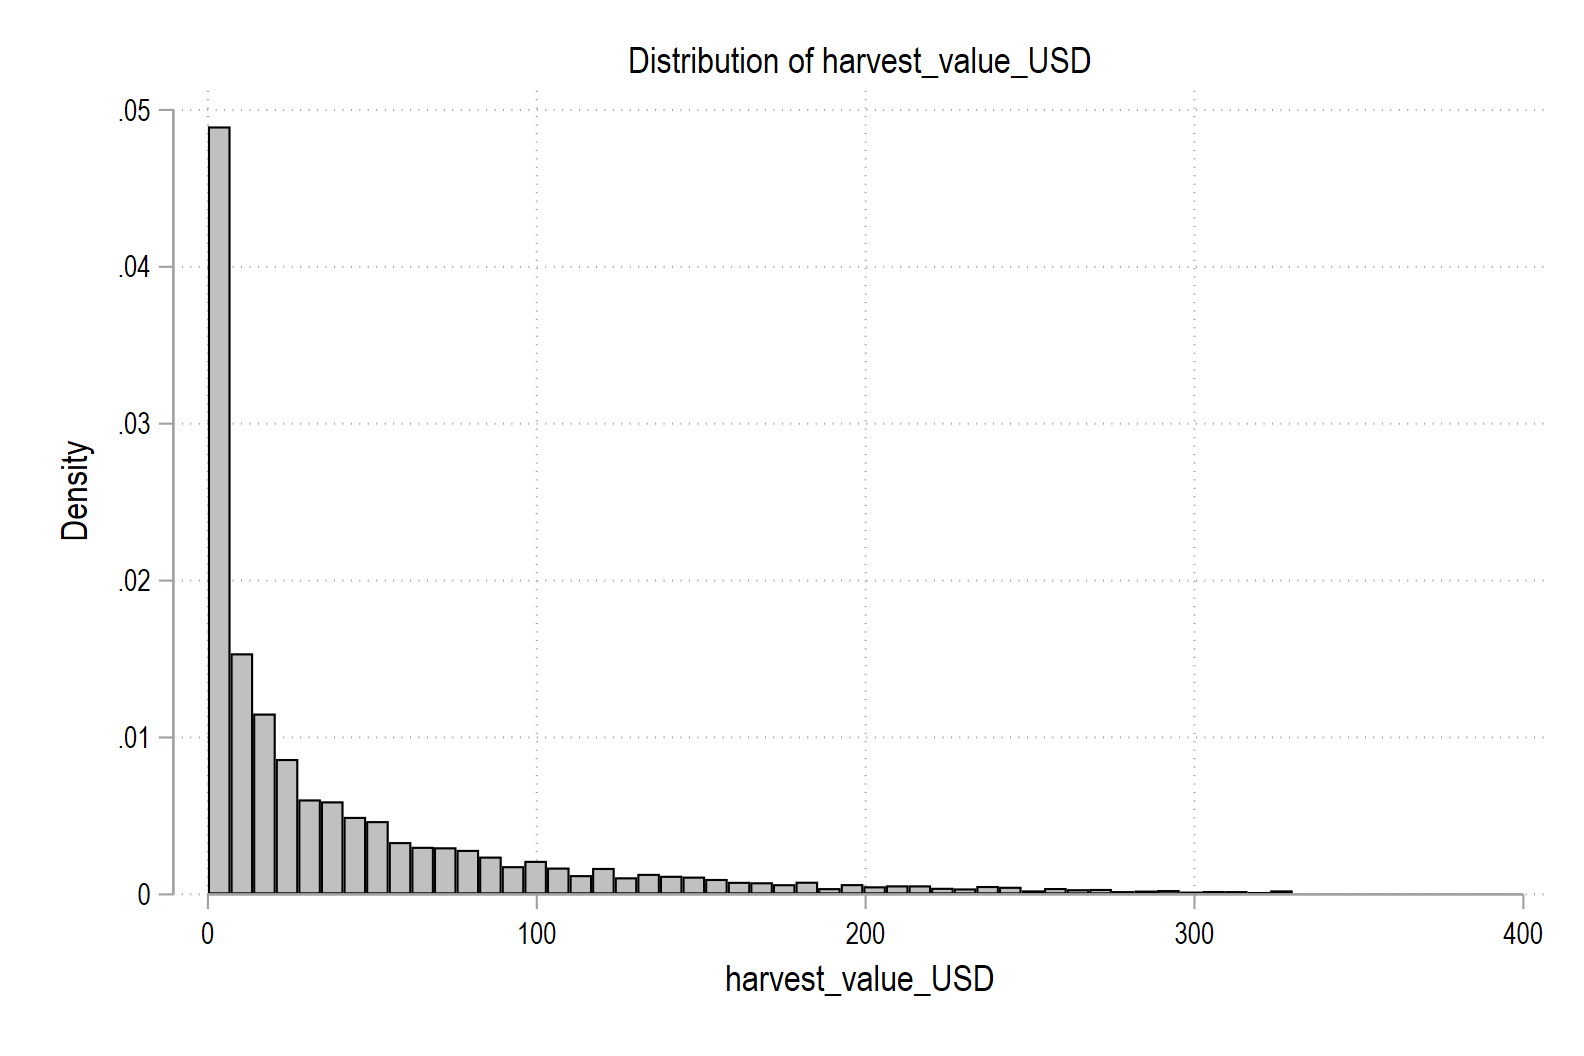
ifloop, tell Stata what to do when theifstatement is not true. That is, draw ahistof the variable`v'. Label the title"Distribution of `v'"and x-axis label"`v'". Save the graph with a name that depends on the variable, e.g.hist_yield_kg.png.In the end, you should have one loop inside another. The outside loop is the
foreachloop above. The inside loop is the one that followsif .... The code for thehistgoes inside the first loop but not inside the second. That second loop tells Stata what to do when theifstatement is true. If the statement is not true, than Stata will automatically draw thehist
Assignment submission checklist
Solutions
- Using Locals in Regressions
- Using Locals to Store Results
- Using Globals
- Storing Results as Numbers
- For Values
- For Each
- Combining Macros and Loops
- Combining Macros and Loops
- Check That Your Code Runs
- Challenge 6 1, 2