Learning Objectives
Following this assignment students should be able to:
- Run simple and multivariate regressions in Stata
- Interpret regression coefficients, standard errors, and p-values
- Use factor variables, interactions, and polynomials
- Choose appropriate standard error corrections (robust, clustered)
- Diagnose collinearity using VIF
Reading
Topics
- Single variable regressions
- Multivariate regressions
- Correcting standard errors
- Weights
- Collinearity
- Measurement error
Readings
- Reading (chapter 13): The Effect
- Reading: Simple linear regressions
Lecture Notes
Exercises
-
Simple Regression (10 pts)
For all the exercises this week we are going to use
eth_allrounds_final.dta. Before we start, after loading the data:- Drop all observations that are not maize
- Generate a variable called
fertthat measures nitrogen fertilizer in kg per hectare (nitrogen_kg / plot_area_GPS). Label the variable. - Generate a variable called
laborthat measures total labor in days per hectare (total_labor_days / plot_area_GPS). Label the variable.
This maize only data set with per hectare inputs will be the one we use for all the exercises this week. It will make our yield function regressions more realistic.
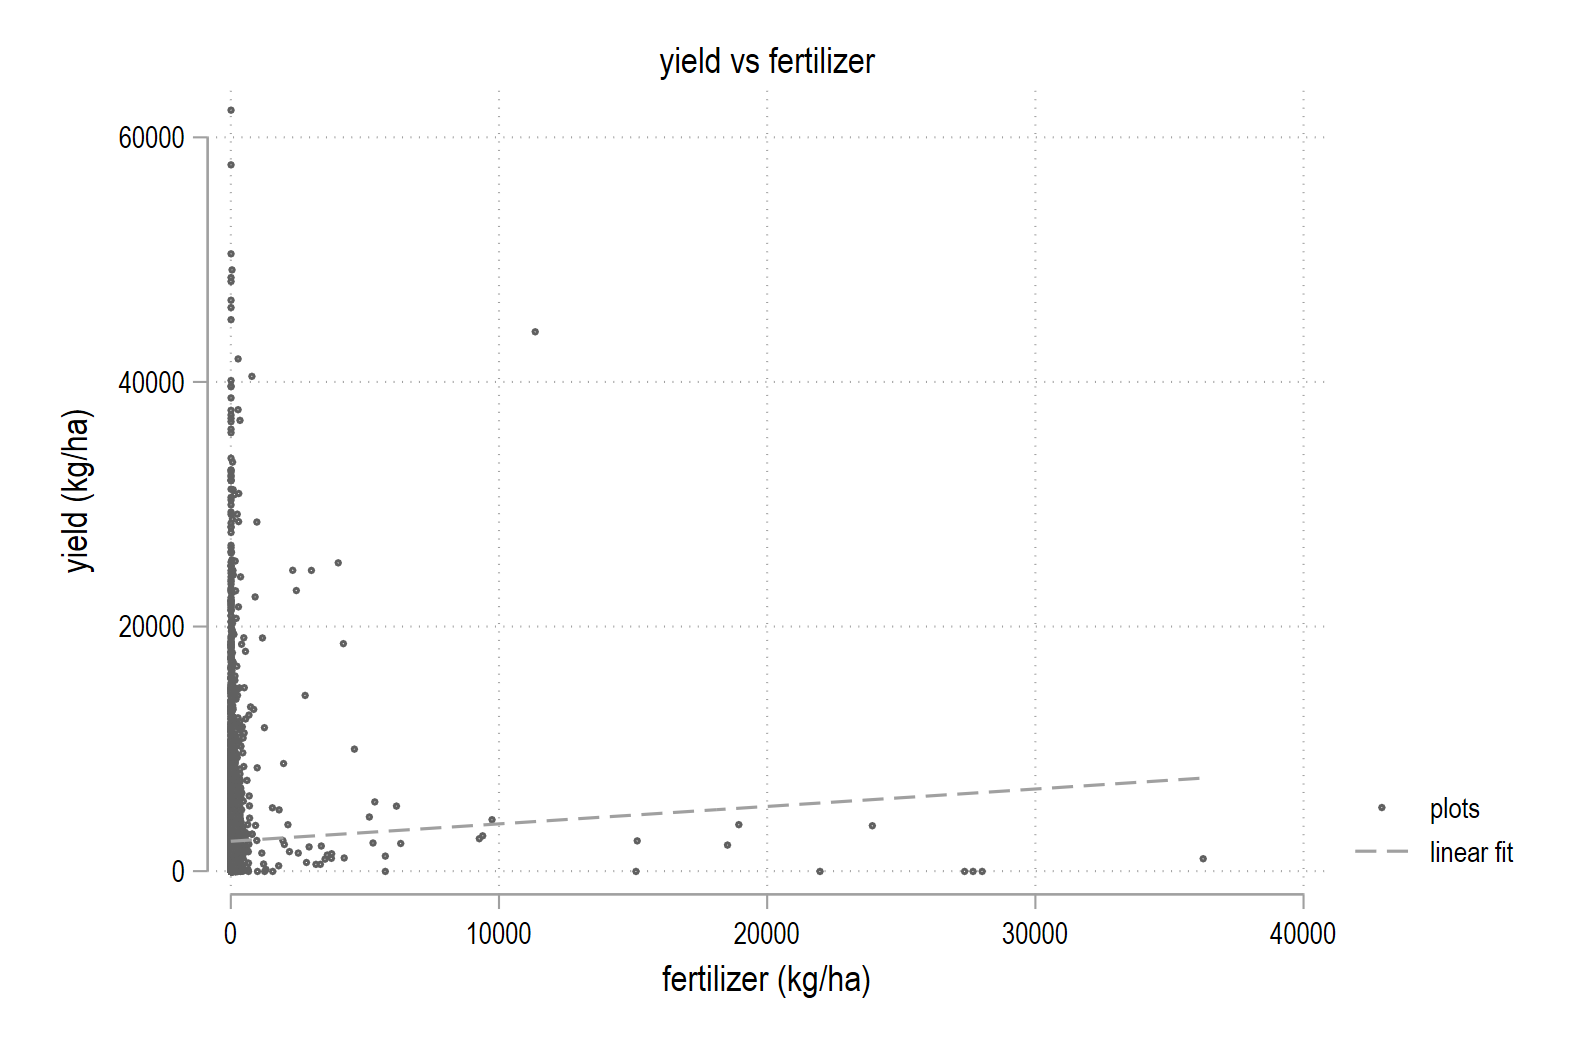
- Create a scatter plot of
yield_kgagainstfertwith a fitted line (lfit) - Run
reg yield_kg fert- What is the slope on
fertand how do you interpret it? - Is it statistically significant at the 5% level?
- What is the R-squared and what does it mean?
- What is the slope on
-
Multivariate Regression (10 pts)
Using the maize only version of
eth_allrounds_final.dtawith per hectare inputs, run a multivariate regression:reg yield_kg fert labor i.irr- How did the coefficient on
fertchange compared to the simple regression? - Interpret the new coefficient on
fertusing the phrase “holding fixed.” - What is the coefficient on
1.irr? Explain it as a difference in averages.
- How did the coefficient on
-
Factor Variables and Interactions (10 pts)
Using the maize only version of
eth_allrounds_final.dtawith per hectare inputs:- Run a regression of
yield_kgonfertandlabor, adding regional fixed effects withi.admin_1. Which region is the omitted reference category? - Run a regression with an interaction between fertilizer (
c.fert) and irrigation (i.irr). What is the coefficient on the interaction term? What does the interaction coefficient mean? - Fit a quadratic in fertilizer. What does the sign of the squared term tell you about diminishing returns?
- Run a regression of
-
Predicting Values (10 pts)
Using the maize only version of
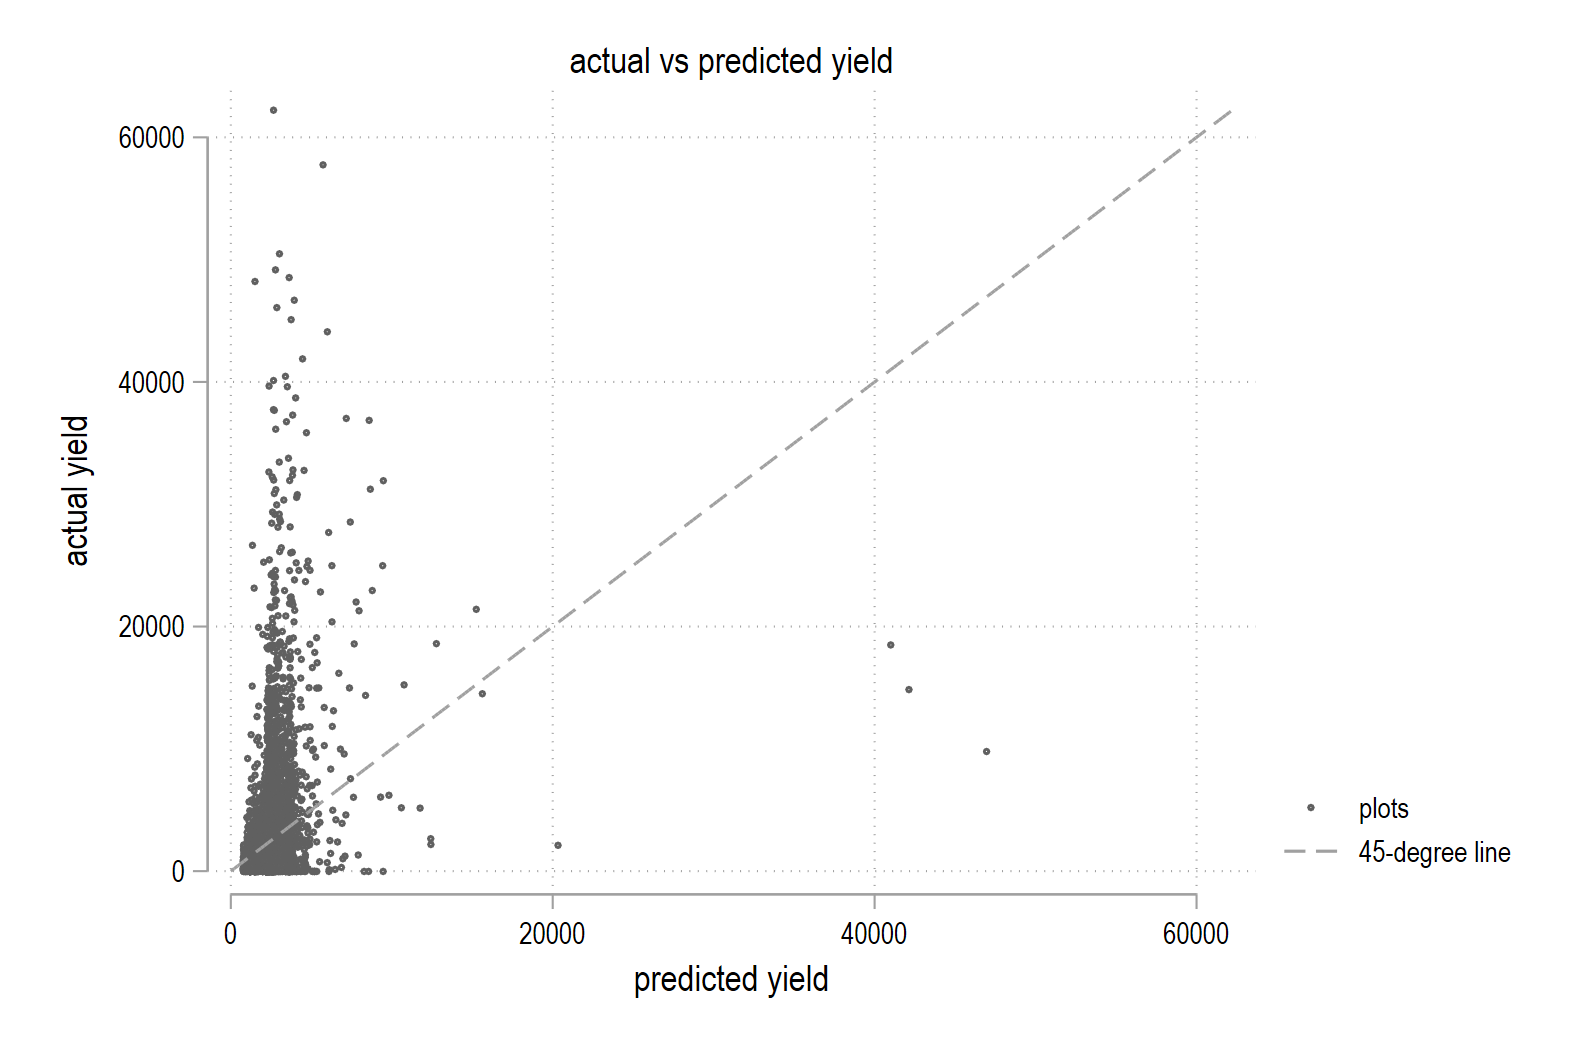
eth_allrounds_final.dtawith per hectare inputs compute and graph predicted values from a regression.- Run
reg yield_kg fert labor i.irr i.admin_1 - Use
predict yhatto generate predicted values - Use
summ yield_kg yhat, meanonlyto find the plotting range - Save the minimum and maximum values for
yhatANDyield_kgas locals, for example:
qui sum yhat, meanonly local yhat_min = r(min) local yhat_max = r(max)- Create locals called
gminandgmaxthat are the minimum and maximum ofyhatandyield_kg. For example,gmin = min(yhat_min’,yield_min') - Use
twoway scatterto create the scatter plot - Add the 45° reference line with
function y = xand use the locals in the range optionfunction y = x, range(gmin'gmax')
- Run
-
Residual Plots (10 pts)
Using the maize only version of
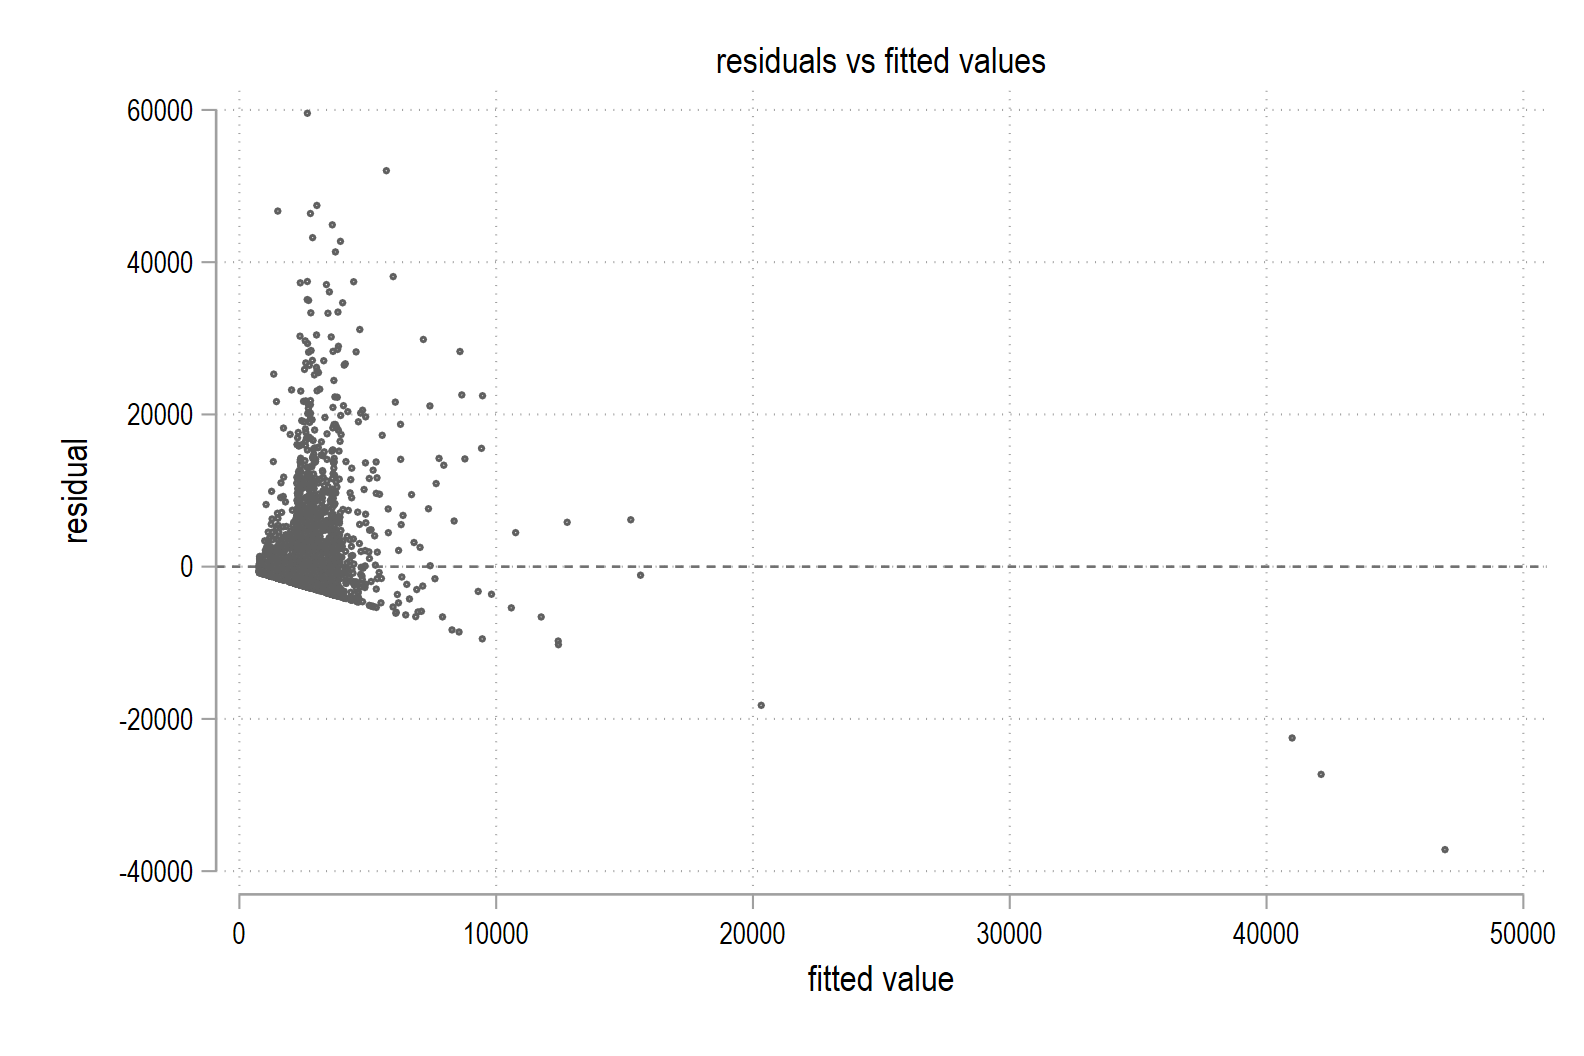
eth_allrounds_final.dtawith per hectare inputs:1. Make a residual-vs-fitted plot and check for heteroskedasticity
- Run
reg yield_kg fert labor i.irr i.admin_1. - Use
predict yhatto generate predicted values. - Use
predict resid, residualsto generate residuals. - Use
twoway scatterto create a scatter plot ofresidagainstyhatwith a horizontal line at zero (yline(0)).
2. Does the vertical spread of residuals change across the x-axis? What does this suggest about heteroskedasticity?
- Run
-
Robust Standard Errors (10 pts)
Using the maize only version of
eth_allrounds_final.dtawith per hectare inputs, compare default and robust standard errors.- Run
reg yield_kg fert labor i.irr i.admin_1(default standard errors). - Run the same regression with
, robustappended.
- Did the coefficients change?
- How did the standard error on
fertchange? - Did the p-value on
fertchange in a way that would affect your conclusions?
- Run
-
Clustered Standard Errors (10 pts)
Using the maize only version of
eth_allrounds_final.dtawith per hectare inputs, compare default and clustered standard errors.- Run
reg yield_kg fert labor i.irr i.admin_1, robust - Run the same regression with clustered standard errors:
, vce(cluster hhid)
- How did the standard error on
fertchange when moving from robust to clustered? - Does clustering at the household level or plot-level make sense for this data?
- Run
-
Collinearity and VIF (10 pts)
Using the maize only version of
eth_allrounds_final.dtawith per hectare inputs, diagnose collinearity with the Variance Inflation Factor.- Run
reg yield_kg fert labor i.irr i.admin_1 seed_value_LCU seed_value_USD - Run
estat vifimmediately after the regression
- Which variables have VIF values above 5? Above 10?
- Why might the seed variables be collinear?
- If VIF is high, does that mean the coefficients are biased, or just imprecise?
- Run
-
Check That Your Code Runs (10 pts)
Sometimes you think you’re code runs, but it only actually works because of something else you did previously. To make sure it actually runs you should save your work and then run it in a clean environment.
Follow these steps in to make sure your code really runs:
-
Restart Stata by closing the instance of Stata that you have open.
-
When you reopen Stata, type in the command line
clear all. Or, better yet, putclear allat the top of your.dofile, after the preamble but before any commands. -
Rerun your entire homework assignment by clicking the
Executebutton to make sure it runs from start to finish and produces the expected results. -
Make sure that you saved your code with the name of the assignment number (i.e.,
assignment_01). You should see the file in your git repo on your machine. -
Make sure that your code will run on other computers (relevant for all assignments after the first assignment)
- No
cd. Use aproject.dofile instead to set directories - Use only relative paths in files other than the
project.dofile - Use
/not\for paths
- No
-
-
Challenge 9 (Challenge - 20 pts)
This challenge uses the maize only version of
eth_allrounds_final.dtawith per hectare inputs to practice skills from all three regression lectures (regression, standard errors, concerns).- Start by creating a variable called
seedthat measures the total seed value for each plot in USD per hectare - Now run a multivariate regression of
yield_kgonfert,labor,seed,i.irr,i.intercropped,i.crop_shock,i.admin_1, andi.wave
1. Interpret the coefficient on
laborusing the phrase “holding fixed”2. Run
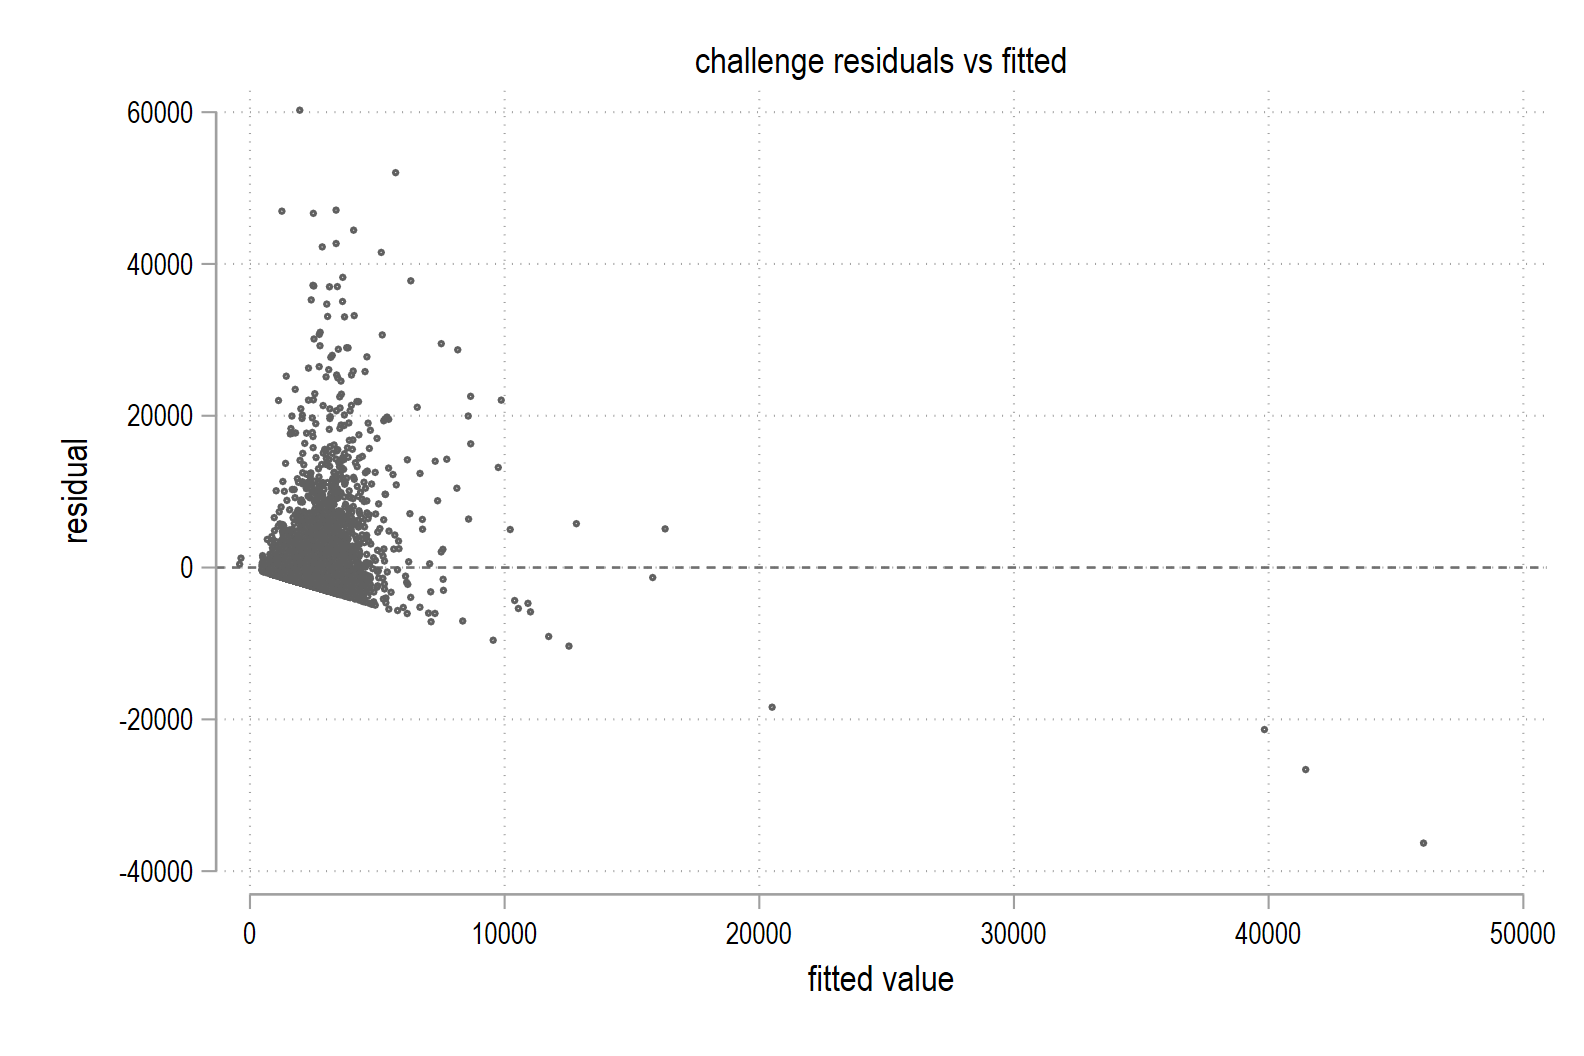
estat vif. Which variables, if any, have VIF values above 5? Explain whether collinearity is a concern in this specification3. Use predict yhat and predict resid, residuals to generate predicted values and residuals
- Create a scatter plot of
residagainstyhatwithyline(0) - Is there evidence of heteroskedasticity?
4. Run the same regression three ways (normal s.e., robust s.e., and s.e. clustered at household)
- What are the standard errors on
ferteach time? - Which approach is most appropriate for these data and why?
5. Run a regression with an interaction between
fertandlabor. How do you interpret the coefficient onfert,labor, andc.fert##c.labor? - Start by creating a variable called
Assignment submission checklist
Solutions
- Simple Regression 1, 2
- Multivariate Regression
- Factor Variables and Interactions
- Predicting Values
- Residual Plots 1, 2
- Robust Standard Errors
- Clustered Standard Errors
- Collinearity and VIF
- Check That Your Code Runs
- Challenge 8 1, 2